- July 24, 2014
- Posted by: Trent Wagner
- Category: News
Entering the year, several investment banks were calling for gold to be down substantially in 2014 – many of whom were forecasting gold to trade under $1000/oz by the end of the year. Well, here we are approximately 7 months into the year and gold is trading near $1300/oz, up approximately $100/oz on the year thus far. So the question now becomes, where is gold going from here?
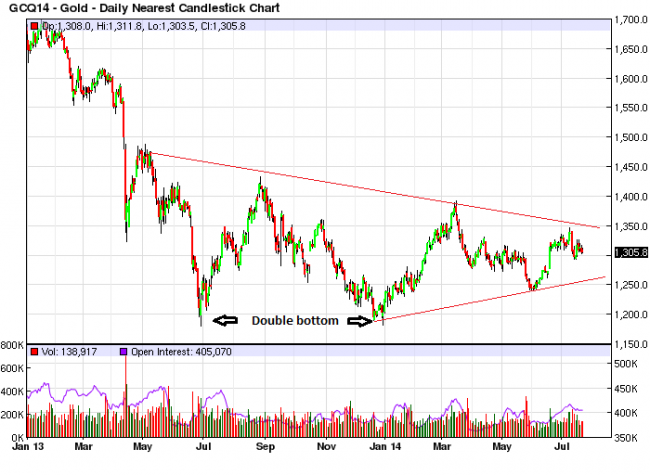
Since bottoming in July of last year near $1180/oz, we’ve seen the price action in gold go into a major consolidative, coiling type pattern. Instead of continuing lower as many expected when we entered 2014, the gold market formed a double bottom on the charts late last year (see below). From there, we’ve entered into a back-and-forth battle between the bulls and bears – with the battle resulting in lower highs and higher lows as we move futher into 2014. History tells us that the market will eventually break out of this consolidation and, looking at the market from a longer term perspective, we favor that eventual breakout to the upside.
In addition to the technical picture in gold, which I would argue is more bullish than bearish, the market has been extremely resilient throughout 2014. Many of the reasons that so many portfolio managers thought gold would trade lower coming into this year have actually come to fruition – and yet gold is up on the year. Strong equity markets, less Fed stimulus, inflation levels beneath Fed targets (although recently some metrics are showing an increase in inflation) – all of these factors should be pressuring gold prices. Despite these perceived headwinds, gold has muscled out a $100/oz gain on the year. This tells me that these factors were already priced into the market as we saw gold plunge in 2013. The $1180/oz level now appears to be a major bottom to a correction within a secular bull trend in gold and, as such, I favor the next major move in gold to be to the upside.

However, in the short term I have a slight negative bias to gold prices. Looking at the chart above, you can plainly see the recent failure of the gold market to break through the resistance area of the aforementioned coiling pattern. Given the geopolitical events of the past 10 days, those familiar with how gold typically reacts to these types of events have to be surprised that we didn’t see a profound move to the upside. What should that tell us? Simply that the market is quite content to continue consolidating in the near term – which means we could see a test of the trend line support near the $1270/oz level over the next couple of weeks.
There are many different strategies one could employ to trade the above scenario – my preference would be to use a calendar call spread. Essentially, this strategy would allow for a longer term call option to be partially financed by selling a closer-to-expiration call option. If the market does retrace in the near term, the short call option would lose value (which is good since we sold it) and we’d still be positioned with the long call option to profit if the gold market makes a move higher at a later time.
Questions or comments? Contact Trent directly at 312-756-0932 or at twagner@tradewithfox.com. Trent can be seen as a regular contributor on Fox Business and is the author of a newsletter, The Weekly Options Trading Report. For a free trial of the newsletter, click on the link below:
http://www.tradewithfox.com/the-weekly-options-trading-report/
*Past performance is not indicative of future performance. Trading futures and options involves substantial risk of loss and is not suitable for all investors.
